AI Video Analytics
Powerful AI Video Analytics Features
NymbleUp’s advanced ai based video analytics deliver actionable insights to optimize customer experience and operational efficiency.
Offering precise visitor counting, demographic insights, and movement pattern analysis to enhance customer flow and optimize store layout and staffing.
Providing real-time monitoring to identify high-engagement hot spots and potential congestion areas.
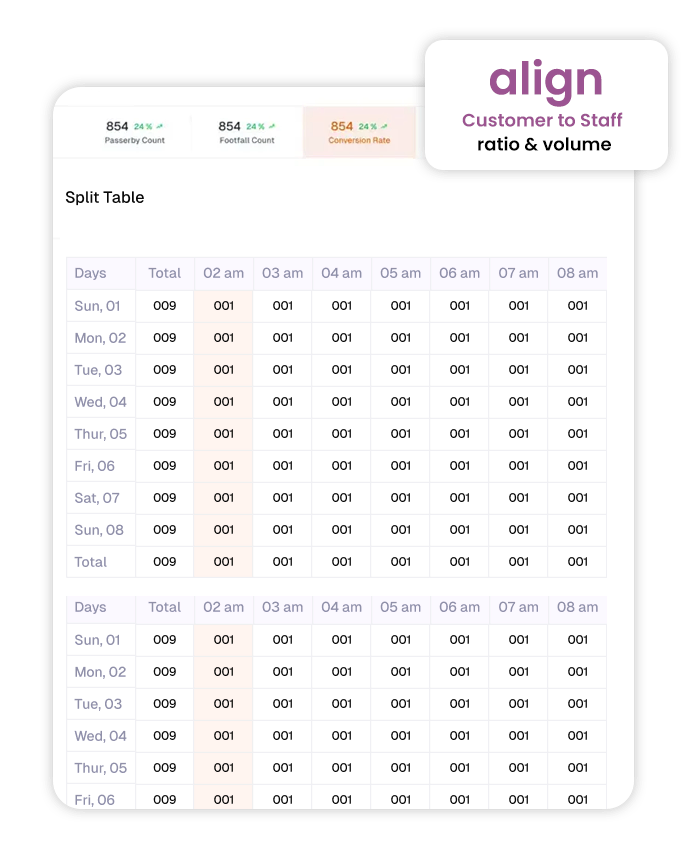
Automatically tracking the ratio to ensure optimal service levels during peak hours, enabling efficient resource allocation.
Using AI based video analytics for instant detection and notification of service issues, such as long queues or standard operating procedure (SOP) deviations.
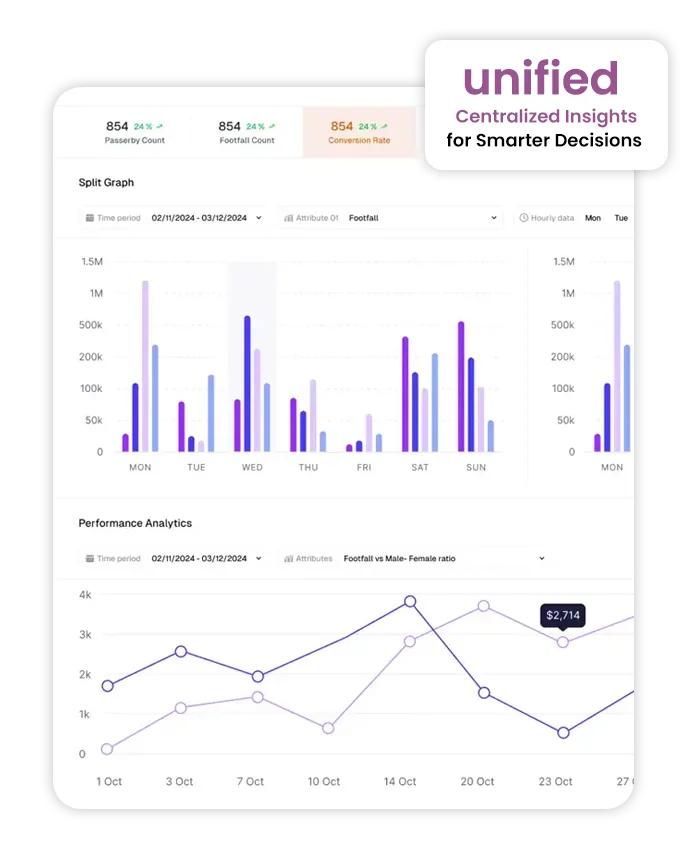
A single, intuitive interface displaying all key performance metrics in real-time, complete with custom reporting and location comparison capabilities, transforming surveillance footage into AI video analytics business intelligence.
Traffic & Footfall Analytics Powered by AI Video Analytics
NymbleUp’s AI-powered video analytics solution helps retail stores and restaurants gain a deeper understanding of how customers interact with their spaces from the storefront to the point of purchase. By combining AI-based video analytics with advanced solutions for retail, businesses can make smarter, data-driven decisions in real time.
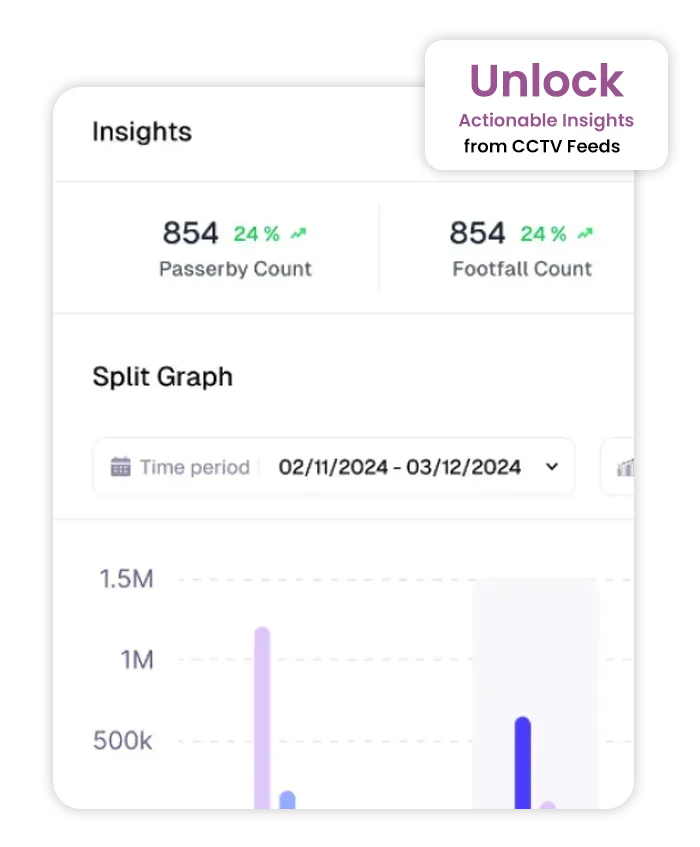
Passerby to Footfall Conversion
Measure how many people walking past your store actually step inside. With AI video analytics, retailers can accurately track passerby-to-footfall conversion rates and assess the effectiveness of window displays, signage, and overall storefront appeal. This is a crucial metric for businesses adopting artificial intelligence in the retail industry to enhance engagement and visibility.
Footfall to Sales Conversion
Understand how many visitors turn into paying customers. Using AI in retail stores, NymbleUp’s system analyzes in store behavior and links footfall data to actual transactions. These insights help evaluate the impact of store layout, promotions, and staff performance on purchase decisions.
Zone-Specific Customer Movement
Leverage AI-based video analytics to generate real-time heatmaps and track movement patterns across your retail zones. Identify high traffic and low engagement areas to optimize product placement, improve signage, and redesign spaces for maximum conversion.
Demographic Insights (Age & Gender)
NymbleUp’s AI-powered video analytics also deliver deep demographic insights including visitor age and gender. Retailers can use this data to personalize promotions, tailor menu offerings, and create experiences that resonate with their target audience.
Occupancy & Dwell Time Tracking with Real-Time AI Video Analytics
Harness the power of AI video analytics to understand exactly how customers engage with different zones in your restaurant or retail store. With NymbleUp’s AI-powered video analytics, businesses gain precise insights into occupancy levels, dwell time, and in store behavior patterns. These real-time insights enable you to optimize space utilization, enhance service quality, and improve overall operational efficiency, making it a core application of artificial intelligence in the retail industry.
Section-Level Engagement
Using AI in retail stores, you can track shopper movement and engagement across various store sections from product aisles and display areas to checkout counters. NymbleUp’s AI-based video analytics measures how long shoppers spend in each area, helping identify high performing zones and pinpointing spaces that may require layout or merchandising adjustments. These data-driven insights empower retailers to make smarter design decisions that boost customer satisfaction and streamline store flow.
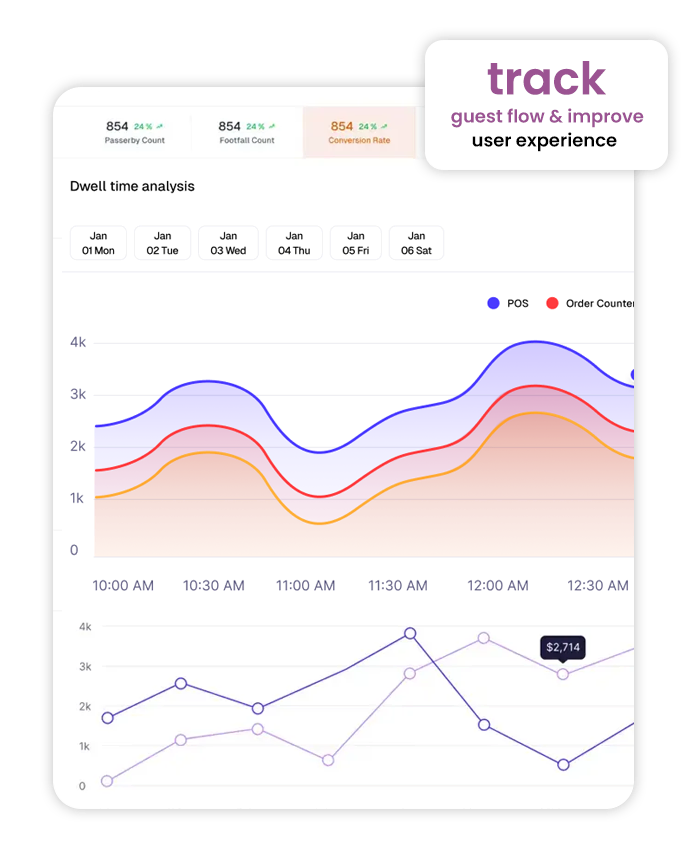
Dwell Time Trends
By leveraging AI video analytics, retailers and restaurants can analyze dwell time patterns to see how long customers remain in specific areas and during which time periods. Longer dwell times can indicate customer engagement or comfort, while shorter durations may reveal friction points or low-interest zones. Understanding these trends helps in optimizing store layouts, improving marketing placements, and personalizing the in-store experience. This level of actionable intelligence showcases the transformative role of artificial intelligence in retail industry operations.
Optimize Table Turnover
NymbleUp’s AI-based video analytics enables restaurants to efficiently manage table turnover by tracking seat occupancy and customer stay duration in real time. This allows businesses to reduce wait times, balance service speed with guest comfort, and allocate staff effectively. For retail environments, it ensures that floor space and staffing are used optimally maximizing both customer satisfaction and profitability. It’s one of the most practical, results-driven examples of AI-powered video analytics in action.
Comprehensive Analytics Dashboard Powered by Real-Time AI Video Analytics
NymbleUp’s AI-powered video analytics dashboard offers a unified, intelligent platform for managing and optimizing retail and restaurant performance. By leveraging AI in retail stores and artificial intelligence in the retail industry, businesses gain instant visibility into key operational metrics, all in one comprehensive view.
Customizable Reports with Real-Time Video Analytics
Generate detailed, data-rich reports tailored to your specific business goals with NymbleUp’s AI video analytics platform. Whether you’re reviewing daily operations or planning long-term strategies, our AI-powered video analytics lets you filter and segment data by time range, performance metric, or store location. These actionable insights help optimize every aspect of retail performance from staffing to layout planning.
Multi-Store Benchmarking with AI Video Analytics
Gain a macro perspective of your entire business network through multi-store benchmarking powered by AI-based video analytics. Compare performance across multiple store locations, track footfall and conversion rates, and identify best performing outlets. With artificial intelligence in retail industry operations, NymbleUp helps you uncover trends, recognize opportunities, and replicate success at scale.
Demographic Breakdown Powered by AI Video Analytics
Understand your customers better with NymbleUp’s AI-powered demographic analytics. Using cutting edge AI video analytics, the system breaks down footfall data by age group, gender, and visit frequency, without compromising customer privacy. These insights help retailers and restaurants personalize experiences, refine marketing strategies, and strengthen customer relationships.
Compliance & Operational Alerts Powered by AI Video Analytics
Automate operational oversight and uphold the highest service standards with NymbleUp’s AI-powered video analytics. By combining AI in retail stores with real-time monitoring, businesses can instantly detect issues, trigger alerts, and maintain smooth, efficient operations across all locations.
Queue Management Alerts
Enhance customer experience through proactive queue management powered by AI video analytics. NymbleUp’s intelligent system instantly notifies staff when lines start getting too long, allowing timely response before customer satisfaction is impacted. This feature showcases how artificial intelligence in the retail industry directly improves operational efficiency and service delivery.
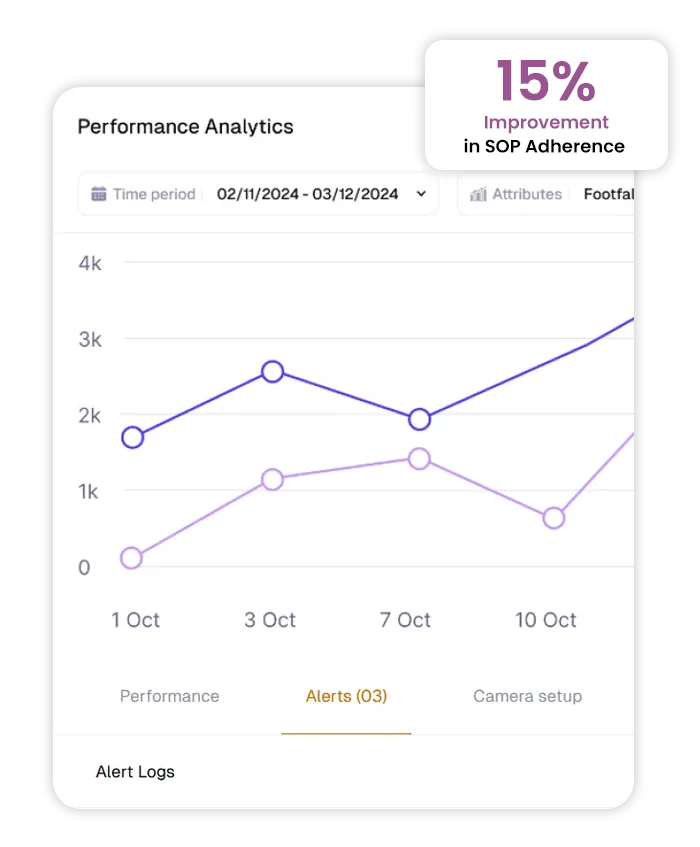
SOP Compliance Tracking
Ensure consistent execution of Standard Operating Procedures (SOPs) with AI-based video analytics. The system continuously monitors whether key operational tasks like keeping counters staffed, maintaining cleanliness, or greeting customers are being properly followed. With AI video analytics, retailers can maintain accountability, reduce supervision overhead, and ensure compliance without manual intervention.
Anomaly Detection
NymbleUp’s AI-powered video analytics goes beyond routine monitoring by detecting unexpected activity patterns in real time. Get instant alerts for anomalies such as a sudden drop in staff activity, unusually high wait times, or unauthorized access in restricted areas. These intelligent alerts enable management to act quickly, prevent losses, and maintain smooth store operations.
Customizable Reports with Real-Time AI Video Analytics
Empower your business with NymbleUp’s AI-powered video analytics platform—designed to deliver data-rich, customizable reports that help retailers and restaurant owners make informed decisions. Whether you’re reviewing daily operations or planning future strategies, AI in retail stores transforms raw data into actionable insights for measurable growth.
Customizable Reports
Create detailed, insight-driven reports filtered by time range, performance metrics, or specific store locations. With AI video analytics, managers can evaluate store efficiency, staff performance, and customer behavior, all in one place. These dynamic reports simplify operational reviews, performance audits, and strategic planning.
Multi-Store Benchmarking
NymbleUp’s AI-based video analytics offers advanced benchmarking capabilities for businesses with multiple outlets. Compare key performance indicators across stores, identify top performers, and replicate successful strategies in underperforming locations. This macro-level visibility powered by artificial intelligence in the retail industry helps ensure consistency and continuous improvement across your retail network.
Demographic Breakdown
Leverage AI-powered video analytics to understand your customer base at a deeper level. Our system analyzes visitor demographics, including age group, gender, and visit frequency, without compromising privacy. These insights help assess campaign effectiveness, ensure customer alignment, and tailor in-store experiences that resonate with specific audience segments.